New · 11 decks · 224 pages · PDF
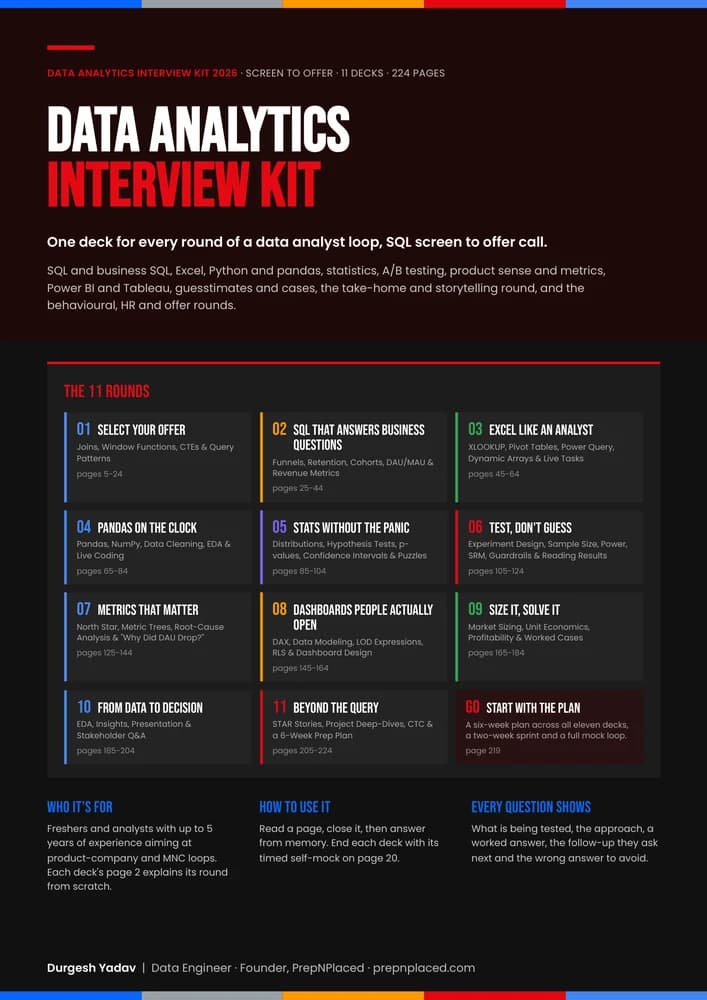
Data Analytics Interview Kit 2026One deck for every round of a data analyst loop, SQL screen to offer call.
SQL and business SQL, Excel, Python and pandas, statistics, A/B testing, product sense, Power BI and Tableau, cases and guesstimates, the take-home and the behavioural and offer rounds. Each deck shows how its round runs and is scored, then works the questions interviewers ask most.
By Durgesh Yadav · Founder · Senior Data Engineer @ 7-Eleven · October 2026
₹499
One payment. PDF, yours to download again any time.
Included free for learners in the Data Analytics cohort, the AI-Powered Data Engineering cohort and in 1:1 mentorship: sign in with the email you enrolled with.
Checked before launch. The SQL, formulas and worked numbers were checked; every error found is fixed in this edition.
- decks, one for each round of a data analyst loop
- 11decks, one for each round of a data analyst loop
- parts to every question: what is tested, approach, answer, follow-up, wrong answer
- 5parts to every question: what is tested, approach, answer, follow-up, wrong answer
- timed self-mocks you score, one at the end of each deck
- 11timed self-mocks you score, one at the end of each deck
- week plan, a two-week sprint and a full mock loop for the whole kit
- 6week plan, a two-week sprint and a full mock loop for the whole kit
What's inside
Eleven decks, one for every round
Each deck is 20 pages: page 2 explains how the round runs and how it is graded, the middle pages work the questions, and the last two are rapid-fire questions and a timed self-mock you score.
Deck 01pages 5-24
Select Your Offer
SQL
SQL is the round most analyst loops are decided in. This deck covers the query patterns that come up again and again, the traps interviewers plant on purpose, and how to talk while you type.
- ROW_NUMBER vs RANK vs DENSE_RANK
- Logical query order, WHERE vs HAVING
- LAG, LEAD, running totals and frames
- Joins that inflate numbers, anti-joins
- Dedup, date spines, gaps and islands
- NULL traps and conditional aggregation
MySQLPostgreSQLBigQuerySnowflakeSQL ServerDuckDB
Deck 02pages 25-44
SQL That Answers Business Questions
Business SQL
Product companies rarely ask "write a join". They ask "did retention get worse?" and expect you to define the metric, write the SQL and say what the number means. This deck is that round.
- Metric definitions interviewers expect you to know
- The cohort retention triangle
- DAU, rolling MAU and stickiness
- Funnels: by user, by session, in order
- D1/D7/D30 retention, done properly
- "GMV fell 8%": a full SQL breakdown + self-mock
BigQuerySnowflakePostgreSQLMixpanelGA4Amplitude
Deck 03pages 45-64
Excel Like an Analyst
Excel
Excel turns up in more than 4 in 10 Indian data analyst job postings, and many loops include a live Excel task on screen share. This deck covers the formulas, pivots and Power Query steps that get tested, on one sample sheet you can rebuild in five minutes.
- FILTER, SORT, UNIQUE, GROUPBY, PIVOTBY
- Pivot tables, % of total, distinct count
- VLOOKUP vs INDEX/MATCH vs XLOOKUP
- SUMIFS, COUNTIFS, SUMPRODUCT logic
- Power Query, data model, what-if tools
- Python in Excel, a live task + self-mock
Excel 365Google SheetsPower QueryPower PivotPython in ExcelLibreOffice
Deck 04pages 65-84
Pandas on the Clock
Python and pandas
Python rounds for analysts are mostly Excel and SQL tasks in code: filter, group, join, reshape, clean, explain. This deck covers them in pandas 3, plus the plain-Python questions that still open many loops.
- How the Python round runs, pandas 3 changes
- Missing values, duplicates, strings, types
- Filtering, groupby, transform, named agg
- Merges, anti-joins and fan-out checks
- Pivot, melt, cohorts and funnels in pandas
- Big files, live coding problems + self-mock
Pythonpandas 3NumPyJupyterMatplotlibDuckDB
Deck 05pages 85-104
Stats Without the Panic
Statistics
Analyst interviews test statistics as judgement, not algebra: which number to trust, whether a difference is real, and how to explain it to someone who has never heard of a p-value. Every number here is computed, not estimated.
- p-values, errors and power
- Which test, when: a decision table
- t-test, chi-square, proportions on real data
- Confidence intervals, said correctly
- Regression, Bayes and probability puzzles
- Simpson's paradox, bias, bootstrap + self-mock
SciPystatsmodelsNumPyRExcel ToolPakJupyter
Deck 06pages 105-124
Test, Don't Guess
A/B testing
Product companies run experiments on almost every change, and analysts design and read them. This round tests whether you can plan a fair test, size it, catch a broken one, and give a decision a product manager can act on.
- A full readout on real test data
- Hypotheses, primary metrics and guardrails
- Sample size, MDE, power and duration
- Sample ratio mismatch: catch broken tests
- Peeking, novelty effects and A/A tests
- When you can't randomise + self-mock
OptimizelystatsmodelsGA4AmplitudeMixpanelBigQuery
Deck 07pages 125-144
Metrics That Matter
Product sense
The product sense round has no code. You get a product, a metric or a mystery, and 30 to 45 minutes to show you think like an owner: define what matters, break it down, find the cause, size the opportunity and make a call.
- Root-cause framework for any metric drop
- Three worked cases: DAU, conversion, delivery time
- North star and input metrics
- Mix vs rate: the decomposition that wins cases
- Opportunity sizing and prioritisation
- Metrics by product type, AI features + self-mock
GA4MixpanelAmplitudeLookerNotionBigQuery
Deck 08pages 145-164
Dashboards People Actually Open
Power BI and Tableau
Power BI shows up in more Indian analyst job descriptions than Tableau, and both rounds test the same things: a clean model, measures that stay correct under any filter, and dashboards that answer a question at a glance.
- How the BI round runs, Power BI vs Tableau
- Star schema, relationships, filter direction
- CALCULATE, ALL, FILTER and time intelligence
- Tableau LOD: FIXED, INCLUDE, EXCLUDE
- RLS, storage modes, refresh and performance
- Critique a dashboard, live build + self-mock
Power BITableauLooker StudioExcelSupersetFabric
Deck 09pages 165-184
Size It, Solve It
Cases and guesstimates
No data, no laptop, one question: "How many orders a day does quick commerce do in Bengaluru?" or "Why is this store losing money?" This round tests structure, assumptions and arithmetic under pressure. Every estimate here comes with its maths checked in code.
- Profitability and unit economics cases
- LTV, CAC and payback in rupees
- Top-down vs bottom-up, with a worked city estimate
- Four guesstimates solved end to end
- Reading a P&L table to find the problem
- Synthesis, mental maths + self-mock
Python checksExcelSheetsUPI dataFood deliveryQuick commerce
Deck 10pages 185-204
From Data to Decision
Take-home and storytelling
Many analyst loops send a dataset and a brief, then ask you to present. The analysis gets you to the presentation; the story gets you the offer. This deck covers scoping, cleaning, finding insights, building the deck and surviving the Q&A, with a full worked take-home.
- How take-homes are run and graded
- Reading the brief and scoping your time
- Question-driven EDA, not chart dumps
- Worked take-home on the sample dataset
- SCQA, action titles and annotated charts
- Presenting and handling tough questions
JupyterPythonPowerPointGoogle SlidesGitHubPower BI
Deck 11pages 205-224
Beyond the Query
Behavioural and offer
The last rounds decide between candidates who all passed the technical bar. This deck covers the stories, the project deep-dive, the resume that gets you the interview, the offer conversation, and the 6-week plan that ties all eleven decks together.
- STAR stories and a reusable story bank
- "Tell me about yourself" for every profile
- The project deep-dive with the hiring manager
- A resume that survives ATS and humans
- HR round, CTC components, in-hand pay
- 6-week plan, full mock loop, final self-mock
LinkedInGitHubNotionSheets trackerMeet / ZoomExcel
How a question page works
Every question shows five things
Interviewers grade the shape of an answer as much as the facts in it. So each question is laid out the way a strong candidate would answer it, with the trap next to it.
- 1TestingWhat the interviewer is actually checking with the question.
- 2ApproachHow to open the answer, before any detail.
- 3AnswerA worked answer, with the SQL, formula or code where it matters.
- 4Follow-upThe question they ask next, and how to take it.
- 5Wrong answerThe answer that sounds fine and loses the round.
Free sample
Read 20 of the 224 pages free
The cover, the contents and one page from every deck:
- p1 The kit cover
- p2 Contents: decks 01 to 04
- p3 Contents: decks 05 to 08
- p4 Contents: decks 09 to 11
- p6 How the SQL round runs
- p7 Logical query order: why your alias breaks
- p8 Joins that lie
- p26 How business SQL rounds work
- p32 The cohort retention triangle
- p46 How the Excel round runs
- p66 How the Python round runs
- p86 Where statistics shows up
- p106 How the experimentation round runs
- p126 How the product sense round runs
- p146 How the BI round runs
- p166 How case and guesstimate rounds work
- p186 How the take-home round runs
- p192 Worked take-home: the diagnosis
- p206 How the final rounds run
- p219 The six-week plan across all 11 decks
Checking your access to the book…
Who it's for
Built for data analyst loops
- You are a fresher or have up to 5 years in analytics and are preparing for product-company or MNC loops
- You want the questions asked now: pandas 3, Excel's GROUPBY and PIVOTBY, Python in Excel, DAX user-defined functions
- You are moving into analytics from another role: each deck's page 2 explains its round from scratch
- You have a loop in two weeks: Deck 11 has a two-week sprint as well as the six-week plan
- You have not learnt SQL or Excel yet. Start with the free roadmap
- You are interviewing for data engineering roles. See the Data Engineering kit
How to use it
- 1. Start with the plan. Deck 11, page 15 maps all eleven decks onto six weeks; page 16 is a two-week sprint if your loop is sooner.
- 2. Read a page, close it, answer from memory. Out loud or on paper. Recall is what the round tests.
- 3. End each deck with its self-mock. Page 20 of every deck is timed and you score it. Ask a friend to play the interviewer.
- 4. Run the full loop. Deck 11, page 17 is a full mock loop in one day. Score it and reread only the pages behind your lowest score.
Checked before launch
Every error found is fixed
Before the kit went on sale, the decks' SQL, formulas and worked numbers were checked. The check found 13 errors, in two NULL rules in SQL, an Excel wildcard formula, the sums in five worked examples, and job-posting figures now taken from PrepNPlaced's own count of 953 Indian data analyst postings. All 13 are corrected in this edition.
Interview content goes out of date fast. If you find something wrong, email support@prepnplaced.com with the deck and page. Corrections go into the copy every buyer downloads from this page.
Questions
Before you buy
Who is the kit for?
Freshers and analysts with up to 5 years of experience preparing for product-company and MNC data analyst loops. Each deck's page 2 explains how its round runs from scratch, so a fresher can follow every deck.
What exactly do I get?
One 224-page PDF: the kit cover, three contents pages where every page title is a link, and 11 decks of 20 pages, one per interview round. Each deck ends with rapid-fire questions and a timed self-mock you score.
Which tools does it cover?
SQL in MySQL, PostgreSQL, BigQuery, Snowflake, SQL Server and DuckDB; Excel 365 and Google Sheets with Power Query; Python with pandas 3 and NumPy; statistics in SciPy and statsmodels; Power BI and Tableau; and product analytics tools like GA4, Mixpanel and Amplitude. Each deck lists its stack on its cover.
Can I read some of it before buying?
Yes. Sign in with Google and read 20 pages free: the cover, the contents, page 2 of every deck and five more.
How accurate is it?
Before launch, the decks' SQL, formulas and worked numbers were checked. The 13 errors found, in two NULL rules in SQL, an Excel wildcard formula, the sums in five worked examples, and job-posting figures now taken from PrepNPlaced's own count of 953 Indian data analyst postings, are corrected in this edition. Found another? Email support@prepnplaced.com with the deck and page.
Is it part of the notes vault or the Learn Pass?
No. Like the other books, it is sold on its own for ₹499. It is included free for Data Analytics and Data Engineering cohort learners and 1:1 mentorship learners.
How do I get the PDF after paying?
Pay once on this page and the download button appears straight away. The PDF is yours to download again any time from this page, signed in with the same Google account. Each copy carries your email in the footer.
Can I get a refund?
Refunds are handled under our Refund Policy. If something is wrong with your copy, email support@prepnplaced.com from the address you paid with and include your order id.
Does it promise a job or an offer?
No. It prepares you for the rounds. Interviews, offers and pay depend on you, the market and the company.