1:1 mentorship with Durgesh Yadav · No batch, just you
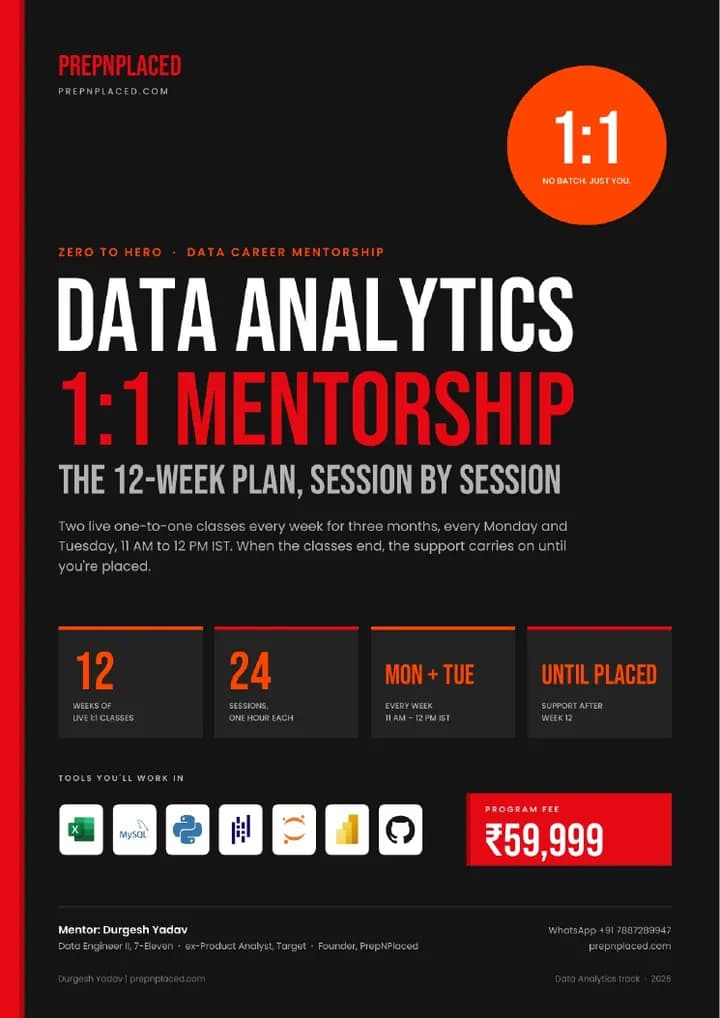
1:1 Data Analytics Mentorship
Three months of live 1:1 classes. Then support until you're placed.
Two live one-to-one classes every week for three months, every Monday and Tuesday, 11 AM to 12 PM IST. When the classes end, the support carries on until you're placed.
12
weeks of live 1:1 classes
24
sessions, one hour each
4
portfolio projects on GitHub
Until placed
support after week 12
₹59,999One fee for both phases: 12 weeks of classes, then support until placed.
Support runs until you're placed. It isn't a job guarantee.
The program at a glance
Two phases, one mentor, one fixed plan
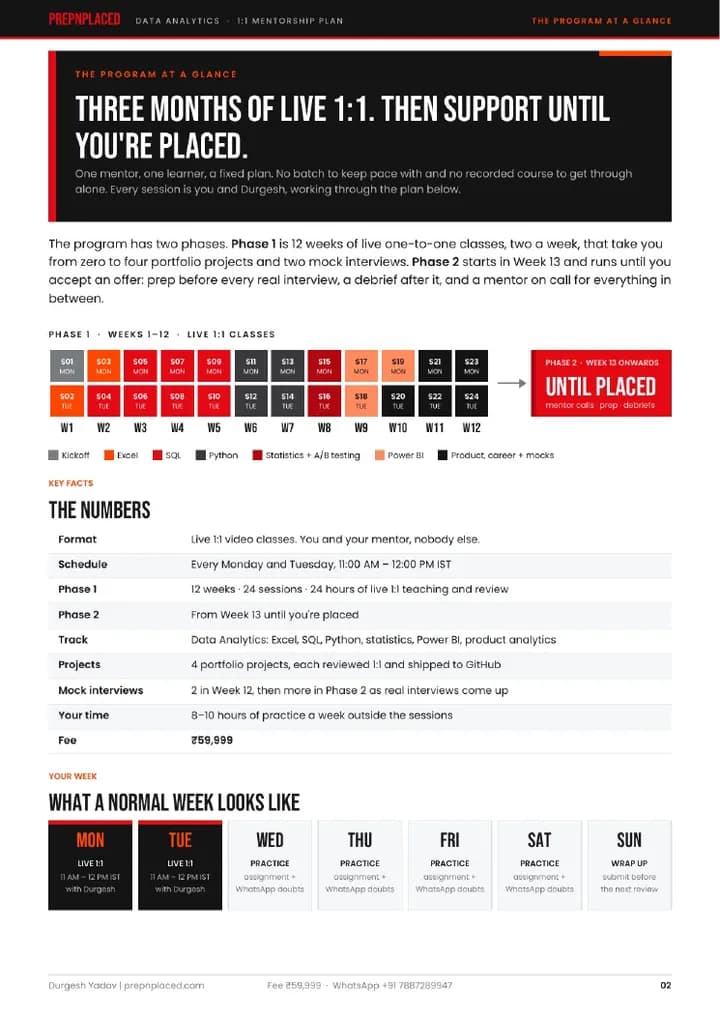
Phase 1 is 12 weeks of live one-to-one classes, two a week, that take you from zero to four portfolio projects and two mock interviews. Phase 2 starts in week 13 and runs until you accept an offer: prep before every real interview, a debrief after it, and a mentor on call for everything in between.
Format
Live 1:1 video classes. You and your mentor, nobody else.
Schedule
Every Monday and Tuesday, 11 AM to 12 PM IST
Phase 1
12 weeks · 24 sessions · 24 hours of live 1:1 teaching and review
Phase 2
From week 13 until you're placed
Track
Data Analytics: Excel, SQL, Python, statistics, Power BI, product analytics
Projects
4 portfolio projects, each reviewed 1:1 and shipped to GitHub
Mock interviews
2 in week 12, then more in Phase 2 as real interviews come up
Your time
8 to 10 hours of practice a week outside the sessions
Fee
₹59,999
What a normal week looks like
MonLive 1:1, 11 AM to 12 PM IST, with Durgesh
TueLive 1:1, 11 AM to 12 PM IST, with Durgesh
Wed to SatPractice: assignment plus WhatsApp doubts
SunWrap up: submit before the next review
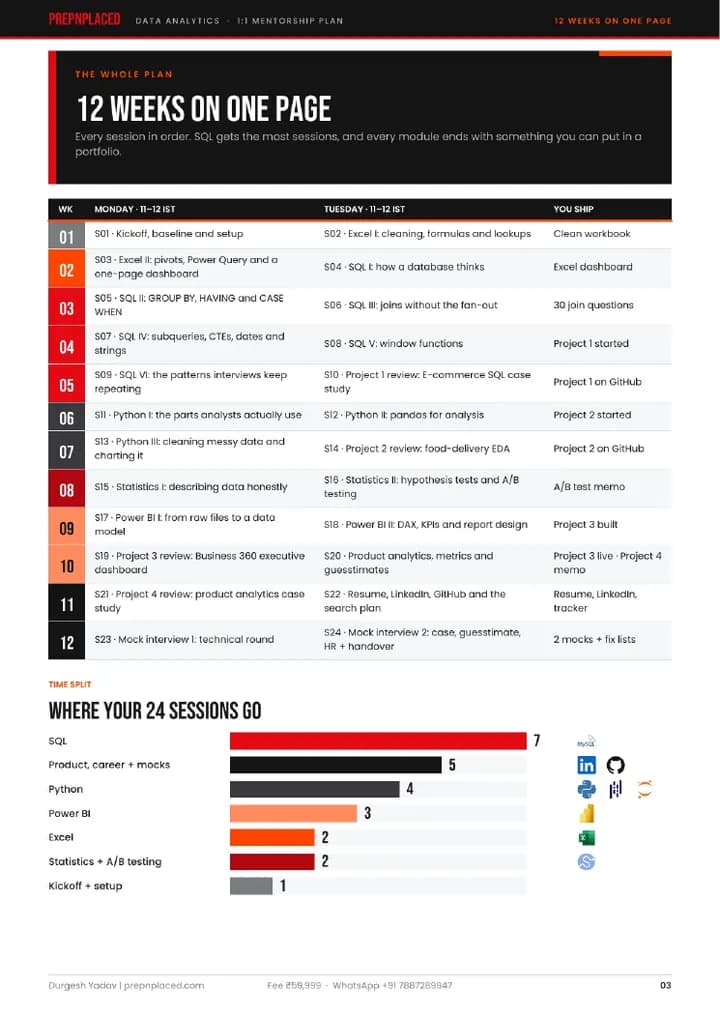
Where your 24 sessions go
SQL7
Product, career and mocks5
Python4
Power BI3
Excel2
Statistics and A/B testing2
Kickoff and setup1
The whole plan
12 weeks, session by session
Every session in order, every Monday and Tuesday, 11 AM to 12 PM IST. SQL gets the most sessions, and every module ends with something you can put in a portfolio.
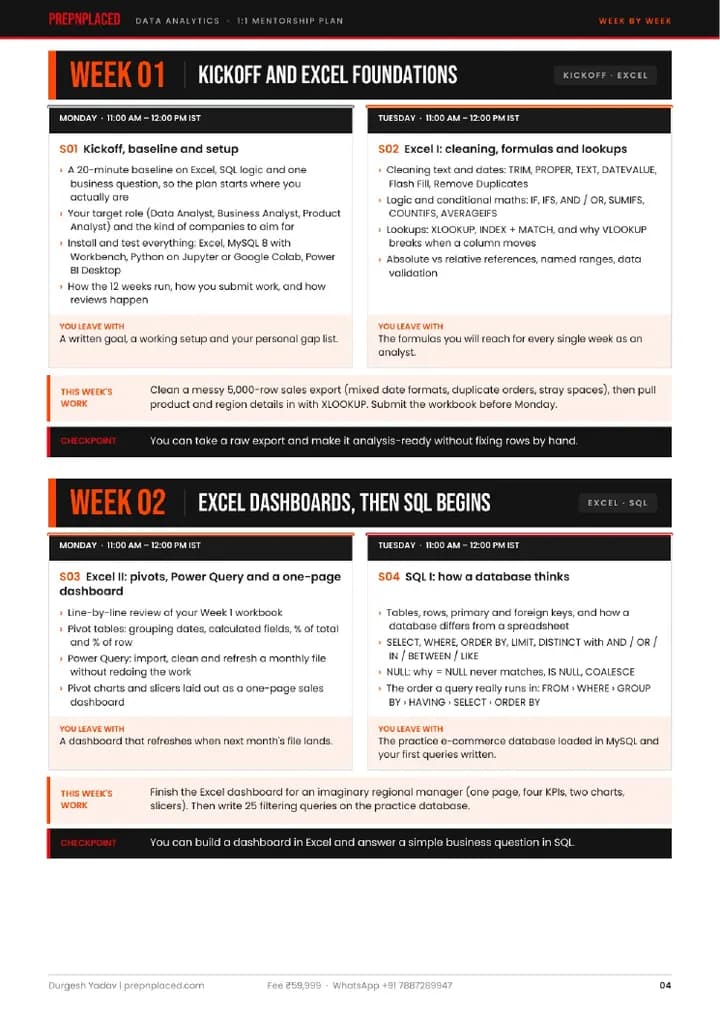
WEEK 01 · Kickoff · Excel
Kickoff and Excel foundations
Clean workbook
Monday
S01 · Kickoff, baseline and setup
What it covers
A 20-minute baseline on Excel, SQL logic and one business question, so the plan starts where you actually are
Your target role (Data Analyst, Business Analyst, Product Analyst) and the kind of companies to aim for
Install and test everything: Excel, MySQL 8 with Workbench, Python on Jupyter or Google Colab, Power BI Desktop
How the 12 weeks run, how you submit work, and how reviews happen
You leave with: A written goal, a working setup and your personal gap list.
Tuesday
S02 · Excel I: cleaning, formulas and lookups
What it covers
Cleaning text and dates: TRIM, PROPER, TEXT, DATEVALUE, Flash Fill, Remove Duplicates
Logic and conditional maths: IF, IFS, AND / OR, SUMIFS, COUNTIFS, AVERAGEIFS
Lookups: XLOOKUP, INDEX + MATCH, and why VLOOKUP breaks when a column moves
Absolute vs relative references, named ranges, data validation
You leave with: The formulas you will reach for every single week as an analyst.
This week's work: Clean a messy 5,000-row sales export (mixed date formats, duplicate orders, stray spaces), then pull product and region details in with XLOOKUP. Submit the workbook before Monday.
Checkpoint: You can take a raw export and make it analysis-ready without fixing rows by hand.
WEEK 02 · Excel · SQL
Excel dashboards, then SQL begins
Excel dashboard
Monday
S03 · Excel II: pivots, Power Query and a one-page dashboard
What it covers
Line-by-line review of your week 1 workbook
Pivot tables: grouping dates, calculated fields, % of total and % of row
Power Query: import, clean and refresh a monthly file without redoing the work
Pivot charts and slicers laid out as a one-page sales dashboard
You leave with: A dashboard that refreshes when next month's file lands.
Tuesday
S04 · SQL I: how a database thinks
What it covers
Tables, rows, primary and foreign keys, and how a database differs from a spreadsheet
SELECT, WHERE, ORDER BY, LIMIT, DISTINCT with AND / OR / IN / BETWEEN / LIKE
NULL: why = NULL never matches, IS NULL, COALESCE
The order a query really runs in: FROM, WHERE, GROUP BY / HAVING, SELECT, ORDER BY
You leave with: The practice e-commerce database loaded in MySQL and your first queries written.
This week's work: Finish the Excel dashboard for an imaginary regional manager (one page, four KPIs, two charts, slicers). Then write 25 filtering queries on the practice database.
Checkpoint: You can build a dashboard in Excel and answer a simple business question in SQL.
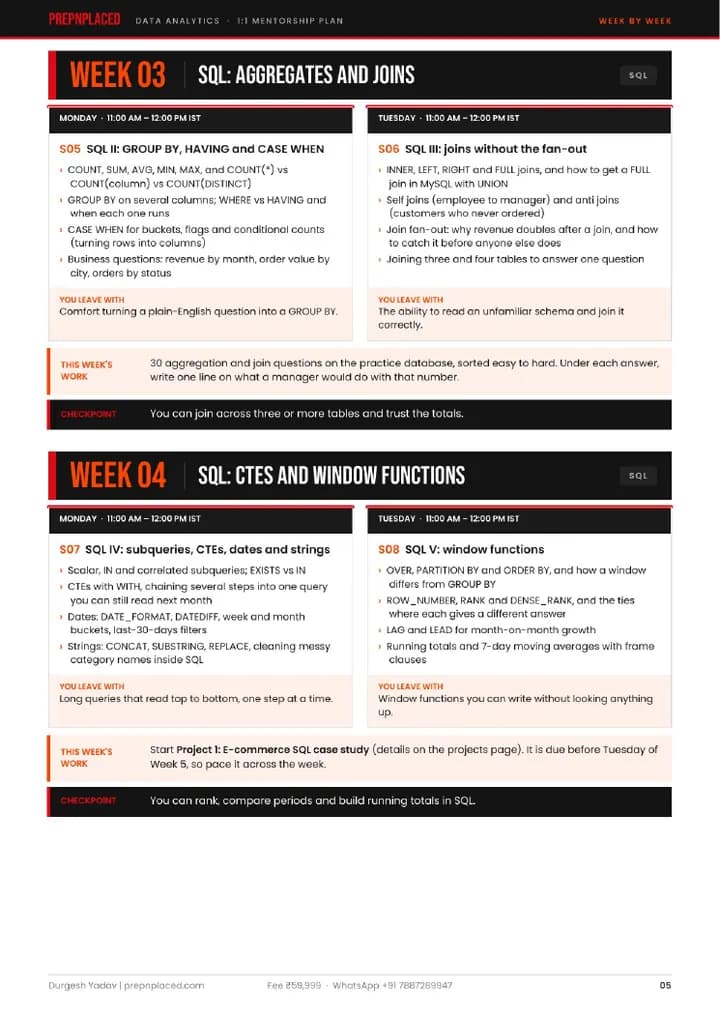
WEEK 03 · SQL
SQL: aggregates and joins
30 join questions
Monday
S05 · SQL II: GROUP BY, HAVING and CASE WHEN
What it covers
COUNT, SUM, AVG, MIN, MAX, and COUNT(*) vs COUNT(column) vs COUNT(DISTINCT)
GROUP BY on several columns; WHERE vs HAVING and when each one runs
CASE WHEN for buckets, flags and conditional counts (turning rows into columns)
Business questions: revenue by month, order value by city, orders by status
You leave with: Comfort turning a plain-English question into a GROUP BY.
Tuesday
S06 · SQL III: joins without the fan-out
What it covers
INNER, LEFT, RIGHT and FULL joins, and how to get a FULL join in MySQL with UNION
Self joins (employee to manager) and anti joins (customers who never ordered)
Join fan-out: why revenue doubles after a join, and how to catch it before anyone else does
Joining three and four tables to answer one question
You leave with: The ability to read an unfamiliar schema and join it correctly.
This week's work: 30 aggregation and join questions on the practice database, sorted easy to hard. Under each answer, write one line on what a manager would do with that number.
Checkpoint: You can join across three or more tables and trust the totals.
WEEK 04 · SQL
SQL: CTEs and window functions
Project 1 started
Monday
S07 · SQL IV: subqueries, CTEs, dates and strings
What it covers
Scalar, IN and correlated subqueries, EXISTS vs IN
CTEs with WITH, chaining several steps into one query you can still read next month
Dates: DATE_FORMAT, DATEDIFF, week and month buckets, last-30-days filters
You leave with: Long queries that read top to bottom, one step at a time.
Tuesday
S08 · SQL V: window functions
What it covers
OVER, PARTITION BY and ORDER BY, and how a window differs from GROUP BY
ROW_NUMBER, RANK and DENSE_RANK, and the ties where each gives a different answer
LAG and LEAD for month-on-month growth
Running totals and 7-day moving averages with frame clauses
You leave with: Window functions you can write without looking anything up.
This week's work: Start Project 1: E-commerce SQL case study. It is due before Tuesday of week 5, so pace it across the week.
Checkpoint: You can rank, compare periods and build running totals in SQL.
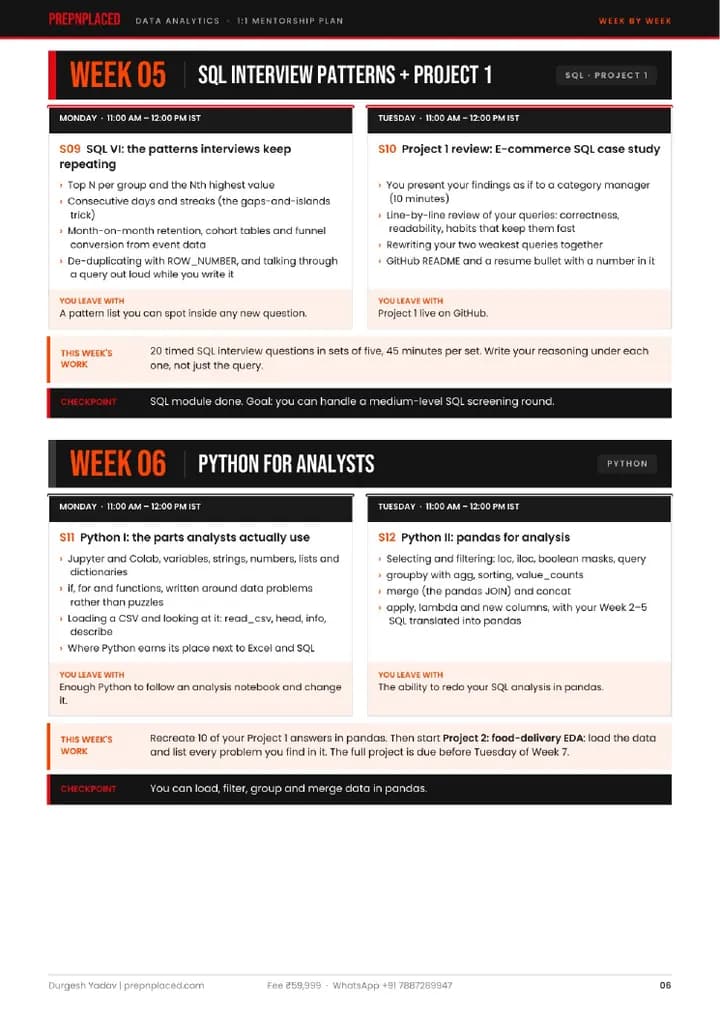
WEEK 05 · SQL · Project 1
SQL interview patterns and Project 1
Project 1 on GitHub
Monday
S09 · SQL VI: the patterns interviews keep repeating
What it covers
Top N per group and the Nth highest value
Consecutive days and streaks (the gaps-and-islands trick)
Month-on-month retention, cohort tables and funnel conversion from event data
De-duplicating with ROW_NUMBER, and talking through a query out loud while you write it
You leave with: A pattern list you can spot inside any new question.
Tuesday
S10 · Project 1 review: E-commerce SQL case study
What it covers
You present your findings as if to a category manager (10 minutes)
Line-by-line review of your queries: correctness, readability, habits that keep them fast
Rewriting your two weakest queries together
GitHub README and a resume bullet with a number in it
You leave with: Project 1 live on GitHub.
This week's work: 20 timed SQL interview questions in sets of five, 45 minutes per set. Write your reasoning under each one, not just the query.
Checkpoint: SQL module done. Goal: you can handle a medium-level SQL screening round.
WEEK 06 · Python
Python for analysts
Project 2 started
Monday
S11 · Python I: the parts analysts actually use
What it covers
Jupyter and Colab, variables, strings, numbers, lists and dictionaries
if, for and functions, written around data problems rather than puzzles
Loading a CSV and looking at it: read_csv, head, info, describe
Where Python earns its place next to Excel and SQL
You leave with: Enough Python to follow an analysis notebook and change it.
Tuesday
S12 · Python II: pandas for analysis
What it covers
Selecting and filtering: loc, iloc, boolean masks, query
groupby with agg, sorting, value_counts
merge (the pandas JOIN) and concat
apply, lambda and new columns, with your week 2-5 SQL translated into pandas
You leave with: The ability to redo your SQL analysis in pandas.
This week's work: Recreate 10 of your Project 1 answers in pandas. Then start Project 2: food-delivery EDA. Load the data and list every problem you find in it. The full project is due before Tuesday of week 7.
Checkpoint: You can load, filter, group and merge data in pandas.
WEEK 07 · Python · Project 2
Cleaning, charts and Project 2
Project 2 on GitHub
Monday
S13 · Python III: cleaning messy data and charting it
What it covers
Missing values: find, drop or fill, and when each choice is the wrong one
Data types, duplicates, outliers with IQR, string cleanup, date parsing
matplotlib and seaborn: line, bar, histogram, box plot, heatmap
Choosing the chart that answers the question, and labelling it so nobody has to ask
You leave with: A cleaning checklist you run on every new dataset.
Tuesday
S14 · Project 2 review: food-delivery EDA
What it covers
You walk through your notebook and the story it tells (10 minutes)
Review of cleaning decisions, chart choices and whether each insight holds up
Turning the notebook into a clean GitHub repo someone will actually open
Resume bullet for the project
You leave with: Project 2 live on GitHub.
This week's work: Finish Project 2 before Tuesday's review. After it, a statistics warm-up: mean, median and % change on your own food-delivery results.
Checkpoint: You can clean a messy dataset in Python and present what it says.
WEEK 08 · Statistics
Statistics and A/B testing
A/B test memo
Monday
S15 · Statistics I: describing data honestly
What it covers
Mean vs median vs mode, and why average order value can mislead
Spread: range, variance, standard deviation, percentiles, IQR
Normal and skewed distributions, and what a long tail means for the business
Sampling, correlation vs causation, and Simpson's paradox on a real example
You leave with: The checks to question a number before you report it.
Tuesday
S16 · Statistics II: hypothesis tests and A/B testing
What it covers
Null and alternative hypotheses, p-values, confidence intervals, Type I and Type II errors
t-test and chi-square, run in Python with scipy
Setting up an A/B test: the metric, sample size, duration, randomisation
Reading a result: significant vs worth acting on, peeking, novelty effects
You leave with: The ability to read an A/B result and say ship, don't ship, or run longer.
This week's work: Analyse a checkout-page A/B test dataset: check the split is fair, run the test, and write a one-page recommendation a product manager could act on.
Checkpoint: You can explain a p-value to a product manager without jargon.
WEEK 09 · Power BI
Power BI
Project 3 built
Monday
S17 · Power BI I: from raw files to a data model
What it covers
Power Query inside Power BI: combine files, fix types, unpivot, merge
Star schema: fact vs dimension tables, and the trouble one flat table causes
Relationships, cardinality and filter direction
A proper date table, and why every model needs one
You leave with: A clean data model, ready for measures.
Tuesday
S18 · Power BI II: DAX, KPIs and report design
What it covers
Measures vs calculated columns: SUM, DIVIDE, COUNTROWS, DISTINCTCOUNT
CALCULATE and filter context, where most DAX mistakes come from
Time intelligence: MTD, YTD, same period last year, % growth
KPI design and layout: what goes top-left, drill-through, tooltips, bookmarks
You leave with: A report a manager could open on Monday morning and use.
This week's work: Build Project 3: Business 360 dashboard in Power BI. Due before Monday's review.
Checkpoint: You can model data, write core DAX and design a report page.
WEEK 10 · Power BI · Product
Project 3 and product analytics
Project 3 live · Project 4 memo
Monday
S19 · Project 3 review: Business 360 executive dashboard
What it covers
You present the dashboard with your mentor playing the CEO (10 minutes)
Review of the model, DAX, visuals, and whether the page answers the brief
Portfolio packaging: screenshots and a 2-minute walkthrough video
Resume bullet for the project
You leave with: Project 3 in your portfolio.
Tuesday
S20 · Product analytics, metrics and guesstimates
What it covers
North Star metrics and metric trees: revenue = users x conversion x order value
Funnels, retention curves, cohorts and DAU / MAU
Root-cause cases: "orders dropped 12% yesterday, what do you check first?"
Guesstimates: structuring a market-size estimate out loud
You leave with: A way to work through case and guesstimate rounds without freezing.
This week's work: Project 4: product analytics case study. Funnel, retention and an A/B readout on app event data, written up as a one-page memo. Due before Monday.
Checkpoint: You can diagnose a metric drop step by step.
WEEK 11 · Project 4 · Career
Project 4 and your job-search kit
Resume, LinkedIn, tracker
Monday
S21 · Project 4 review: product analytics case study
What it covers
Your memo read the way a product manager would read it
Funnel and retention logic, the A/B readout and the recommendation
How to tell each project in two minutes in an interview
Final portfolio check across all four projects
You leave with: Four projects, and a story for each.
Tuesday
S22 · Resume, LinkedIn, GitHub and the search plan
What it covers
Resume: one page, ATS-friendly, project bullets with numbers
LinkedIn: headline, About, featured projects, how recruiters search
GitHub: pinned repos and READMEs a hiring manager will open
Search plan: target roles and companies, referrals, a daily application routine
You leave with: A final resume, an updated LinkedIn and an application tracker.
This week's work: Send your first batch of applications and log them in the tracker. Revise SQL and Excel for Monday's mock.
Checkpoint: Portfolio and profile done. You are applying.
WEEK 12 · Mocks
Mock interviews and handover
2 mocks + fix lists
Monday
S23 · Mock interview 1: technical round
What it covers
45 minutes run like a real interview: live SQL, then Excel and Python questions
15 minutes of feedback, round by round
Written feedback sheet: what held up, what cost you
You leave with: A fix list for the technical round.
Tuesday
S24 · Mock interview 2: case, guesstimate, HR and handover
What it covers
A business case, a guesstimate and one statistics question
HR questions: tell me about yourself, why data, notice period, salary expectations
Feedback and fix list
Handover: how Phase 2 support works from next week
You leave with: Two mocks done and a plan for your next 30 days of applications.
This week's work: Work through both fix lists and keep applying. From next week, every interview call you get goes to your mentor.
Checkpoint: Phase 1 complete. Placement support starts.
What you'll have to show
Four portfolio projects
Each one is built between sessions, reviewed 1:1 line by line, and shipped to GitHub with a README and a resume bullet. Together they cover dashboards, end-to-end analysis, product analytics and executive reporting.
PROJECT 01 · Weeks 4-5 · reviewed in S10
E-commerce SQL case study
The data: Practice e-commerce database: customers, orders, order items, products.
Monthly revenue trend and month-on-month growth
Top products per category and slow movers
Repeat-customer rate and a monthly cohort retention table
City-level order value and cancellation patterns
You ship: SQL file, README with findings, resume bullet
PROJECT 02 · Weeks 6-7 · reviewed in S14
Food-delivery EDA in Python
The data: Messy food-delivery orders: missing ratings, mixed date formats, duplicate orders.
Profile and clean the data, documenting every decision
Peak hours, cuisine and city performance
What drives delivery time, with charts that make it clear
Five findings a restaurant-ops team could act on
You ship: Jupyter notebook, charts, README, resume bullet
PROJECT 03 · Weeks 9-10 · reviewed in S19
Business 360 dashboard in Power BI
The data: Retail sales, customers and products, modelled as a star schema.
Executive overview page: revenue, margin, growth vs last year
Sales, customer and product pages with drill-through
DAX measures for MTD, YTD and same period last year
A layout a senior manager can read in 30 seconds
You ship: pbix file, screenshots, 2-minute walkthrough video
PROJECT 04 · Weeks 10-11 · reviewed in S21
Product analytics case study
The data: App event data: visits, add-to-cart, checkout, purchase, plus an A/B test.
Funnel from visit to purchase, and where users drop
Weekly retention cohorts
A/B test readout with a clear ship or don't-ship call
One-page memo with the recommendation up top
You ship: Analysis (SQL or Python) and a one-page memo
Phase 2 · week 13 onwards
Support until you're placed
The live classes end with week 12. The mentorship doesn't. From week 13 the work shifts from learning to landing: every real interview gets prep before it and a debrief after it.
How every interview gets handled
1Applytracker + referrals
2Interview callsend the JD
3Prep callrole + round pattern
4Interviewyou, on your own
5Debriefwhat to fix next
6Offercompare + negotiate
Not yet? Fix it, then go again.
01
Mentor calls when you need them
Stuck on an application, unsure about a role, or need a second look at something? Book a 1:1 call. The weekly Monday-Tuesday classes end with week 12; the mentorship doesn't.
02
Prep before every real interview
Got a call? Send the JD. Before the interview you go through the role, that company's round pattern and the questions most likely to come up.
03
Debrief after every interview
What they asked, where you lost marks, and what to fix before the next one. Over a few interviews this is where most of the improvement happens.
04
More mock interviews
When real interviews line up, you get mocks aimed at that company's rounds, not a generic set.
05
Resume and outreach, tuned per role
Resume edits for specific openings, and review of your referral and recruiter messages.
06
Offer stage
Comparing offers, notice periods and joining dates, and how to negotiate without putting the offer at risk.
Straight talk on placement. Support runs until you're placed. It isn't a job guarantee: the offer comes from interviews you clear yourself, and the practice between sessions is yours to do. What doesn't stop is the help. Every interview you get, you walk in prepared and walk out with a debrief.
Fee and what's included
One fee. Both phases.
₹59,999
The fee covers the 12 weeks of live 1:1 classes and the placement support that follows, for as long as it takes.
Questions on eligibility, the curriculum or fit? Message Durgesh before you enrol.
24 live 1:1 sessions with Durgesh, one hour each, every Monday and Tuesday, 11 AM to 12 PM IST, for 12 weeks
A fixed plan in a fixed order, with pace and depth adjusted to you after the Session 1 baseline
Weekly assignments, reviewed in your sessions
Four portfolio projects, each reviewed 1:1 and shipped to GitHub with a resume bullet
Two full mock interviews in week 12, with written feedback
Resume, LinkedIn and GitHub review, plus a job-search plan and application tracker
Doubts between sessions on WhatsApp
Phase 2: mentor calls, interview prep, debriefs and mocks until you're placed
Your side of the deal
Join both sessions every week, on time. Two hours a week of 1:1 only works if both hours happen.
Put in 8 to 10 hours of practice a week outside the sessions. The sessions teach; the practice makes it stick.
Submit each assignment before the session that reviews it.
In Phase 2, keep applying and send every interview call to your mentor as soon as it comes in.
Before you enrol
Who this is for
Freshers and final-year students aiming for a first Data Analyst, Business Analyst or Product Analyst role.
Working professionals switching in from sales, operations, finance, support or any other function.
Software engineers moving from building apps to working with data.
Non-technical graduates starting from zero. Week 1 assumes nothing.
Anyone ready to practise between sessions. The plan works if the hours go in.
Your mentor
Durgesh Yadav
The person on the other side of all 24 sessions and every Phase 2 call. He builds data pipelines for a living and has spent years teaching analytics and data engineering on the side.
Durgesh Yadav
Data Engineer II at 7-Eleven · ex-Product Analyst, Target · Founder, PrepNPlaced
7-Eleven · Data Engineer II · Since Aug 2024Builds supply-chain and vendor-payment pipelines in PySpark on Databricks, with data-quality checks and KPI dashboards used by product and demand-chain teams.
Target · Product Analyst · Oct 2022 to Jul 2024Worked on e-commerce data running past a billion rows: advanced SQL, PostgreSQL, Hive and DOMO dashboards.
Coforge · Data Analyst · Nov 2021 to Oct 2022
Teaching and mentoring
1:1 mentorship on Topmate since September 2022
Data Analytics Instructor and Mentor at GeeksforGeeks, since May 2024
Data Engineering Mentor and Instructor at Bosscoder Academy, since June 2025
Data Analytics Instructor at Scaler, since March 2026
Data Engineering Instructor at Analytics Vidhya
Why that matters for you
Has sat 20+ Data Analytics and Data Engineering interviews himself, so the mocks come from real rounds
Certified: Azure DP-203, Databricks / Spark, AWS Data Analytics, Google Data Analyst
B.Tech in Computer Science, Dr. APJ Abdul Kalam Technical University
300+ engineers Durgesh Yadav has personally mentored 1:1 have gone on to roles at top technology companies. This is Durgesh's personal 1:1 mentorship record, not a PrepNPlaced placement guarantee.
The plan, as a PDF
Read the full 14-page plan
The same plan as this page, in the form you can save, share or print. Click any page to open it.
Yes. SQL starts from SELECT in week 2 and Python starts from variables in week 6. What you need is time to practise, not a background.
What do I need on my laptop?
Microsoft Excel (desktop), MySQL 8 with Workbench, Python through Anaconda/Jupyter or Google Colab, and Power BI Desktop. Power BI Desktop runs only on Windows, so if you're on a Mac, raise it in Session 1 and it gets sorted well before week 9.
How much time does this take outside the sessions?
Plan for 8 to 10 hours a week of practice and assignments on top of the two live hours.
Is placement guaranteed?
No. Support continues until you're placed, but the offer comes from interviews you clear yourself. What this program guarantees is that you prepare for each of them with a mentor, and debrief after each one.
What happens after week 12?
The Monday-Tuesday classes end and Phase 2 begins: mentor calls, company-specific prep, debriefs after every interview and more mocks, running until you accept an offer.
How much does the 1:1 Data Analytics Mentorship cost?
₹59,999. One fee covers both phases: the 12 weeks of live 1:1 classes and the placement support that follows.